A real estate developer is planning to build a condominium development in a resort community. The company is trying to decide between building a small, medium, or large development. The payoffs (in $1,000s) received for each size of development will depend on the market demand for condominiums in the area, which could be low, medium, or high. The payoff matrix for this decision problem is: (Payoffs in $1,000s) Market Demand Size of Development Low Medium High Small 450 450 450 Medium 250 550 550 Large -350 350 850 The company estimates a 20% chance that market demand will be low, a 35% chance that it will be medium, and a 45% chance that it will be high. The developer can hire a consultant to predict the most likely level of demand for this project. This consultant has done many similar studies and has provided the developer with the following joint probability table summarizing th accuracy of the results. Forecasted Demand Low Low Medium Actual Demand Medium High 0.1600 0.0100 0.0300 0.0420 0.2660 0.0420 High 0.0135 0.0360 0.4005 The sum of the entries on the main diagonal of this table indicates that the consultant's forecast is correct about 82.65% of the time, overall. (a) Construct the conditional probability table showing the probabilities of the various actual demands given each of the forecasted demands. Actual Demand Forecasted Demand Low Medium High Low 0.7422 × 0.0319 0.0636 x Medium 0.1949 × 0.8493 0.0890 High 0.0628 × 0.1151 x 0.8474
A real estate developer is planning to build a condominium development in a resort community. The company is trying to decide between building a small, medium, or large development. The payoffs (in $1,000s) received for each size of development will depend on the market demand for condominiums in the area, which could be low, medium, or high. The payoff matrix for this decision problem is: (Payoffs in $1,000s) Market Demand Size of Development Low Medium High Small 450 450 450 Medium 250 550 550 Large -350 350 850 The company estimates a 20% chance that market demand will be low, a 35% chance that it will be medium, and a 45% chance that it will be high. The developer can hire a consultant to predict the most likely level of demand for this project. This consultant has done many similar studies and has provided the developer with the following joint probability table summarizing th accuracy of the results. Forecasted Demand Low Low Medium Actual Demand Medium High 0.1600 0.0100 0.0300 0.0420 0.2660 0.0420 High 0.0135 0.0360 0.4005 The sum of the entries on the main diagonal of this table indicates that the consultant's forecast is correct about 82.65% of the time, overall. (a) Construct the conditional probability table showing the probabilities of the various actual demands given each of the forecasted demands. Actual Demand Forecasted Demand Low Medium High Low 0.7422 × 0.0319 0.0636 x Medium 0.1949 × 0.8493 0.0890 High 0.0628 × 0.1151 x 0.8474

College Algebra (MindTap Course List)
12th Edition
ISBN:9781305652231
Author:R. David Gustafson, Jeff Hughes
Publisher:R. David Gustafson, Jeff Hughes
Chapter6: Linear Systems
Section6.2: Guassian Elimination And Matrix Methods
Problem 88E

Related questions
Question
Plese, answer me immediately
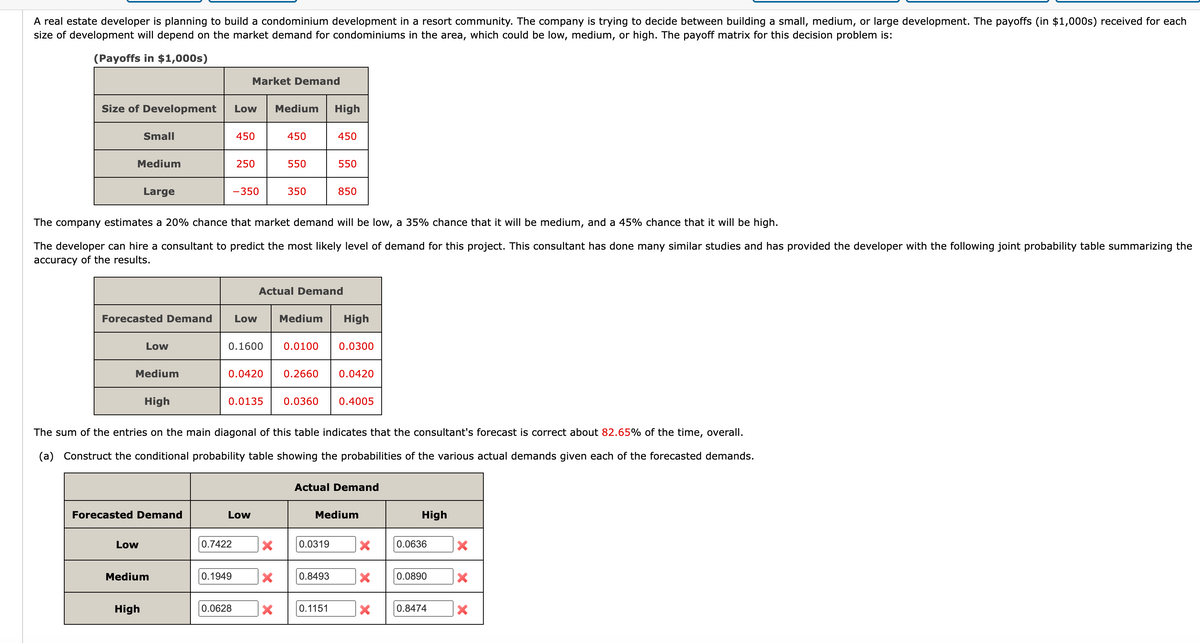
Transcribed Image Text:A real estate developer is planning to build a condominium development in a resort community. The company is trying to decide between building a small, medium, or large development. The payoffs (in $1,000s) received for each
size of development will depend on the market demand for condominiums in the area, which could be low, medium, or high. The payoff matrix for this decision problem is:
(Payoffs in $1,000s)
Market Demand
Size of Development
Low Medium
High
Small
450
450
450
Medium
250
550
550
Large
-350
350
850
The company estimates a 20% chance that market demand will be low, a 35% chance that it will be medium, and a 45% chance that it will be high.
The developer can hire a consultant to predict the most likely level of demand for this project. This consultant has done many similar studies and has provided the developer with the following joint probability table summarizing the
accuracy of the results.
Actual Demand
Forecasted Demand
Low
Medium
High
Low
0.1600
0.0100 0.0300
Medium
0.0420
0.2660
0.0420
High
0.0135 0.0360 0.4005
The sum of the entries on the main diagonal of this table indicates that the consultant's forecast is correct about 82.65% of the time, overall.
(a) Construct the conditional probability table showing the probabilities of the various actual demands given each of the forecasted demands.
Actual Demand
Forecasted Demand
Low
Medium
High
Low
0.7422
×
0.0319
×
0.0636
×
Medium
0.1949
×
0.8493
×
0.0890
×
High
0.0628
×
0.1151
×
0.8474
×
Expert Solution
This question has been solved!
Explore an expertly crafted, step-by-step solution for a thorough understanding of key concepts.

This is a popular solution!

Trending now
This is a popular solution!

Step by step
Solved in 3 steps with 6 images

Recommended textbooks for you
College Algebra (MindTap Course List)
Algebra
ISBN:
9781305652231
Author:
R. David Gustafson, Jeff Hughes
Publisher:
Cengage Learning

Algebra and Trigonometry (MindTap Course List)
Algebra
ISBN:
9781305071742
Author:
James Stewart, Lothar Redlin, Saleem Watson
Publisher:
Cengage Learning

College Algebra
Algebra
ISBN:
9781305115545
Author:
James Stewart, Lothar Redlin, Saleem Watson
Publisher:
Cengage Learning
College Algebra (MindTap Course List)
Algebra
ISBN:
9781305652231
Author:
R. David Gustafson, Jeff Hughes
Publisher:
Cengage Learning
Algebra and Trigonometry (MindTap Course List)
Algebra
ISBN:
9781305071742
Author:
James Stewart, Lothar Redlin, Saleem Watson
Publisher:
Cengage Learning
College Algebra
Algebra
ISBN:
9781305115545
Author:
James Stewart, Lothar Redlin, Saleem Watson
Publisher:
Cengage Learning